Deploying Scalable Inference on a Cluster
In this tutorial, we will demonstrate using LLMBoost to deploy scalable LLM inference services on a multi-node cluster. The user only needs to provide LLMBoost with a JSON file describing the participating nodes. Under the hood, LLMBoost orchestrates a scalable Kubernetes deployment.
Kubernetes will be automatically configured by LLMBoost; the user does not need to install Kubernetes manually.
Step 0: Before you start
0.1: Identify the manager and worker nodes
You need to identify a "manager" node to control the deployment. You also need to identify "worker" nodes that will serve the inference. (For this tutorial, you need at least two worker nodes. You can use a standalone manager node or use one of the worker nodes as the manager. The latter is not recommended for production deployments.)
0.2: Set up SSH key between manager and worker nodes
You need to set up SSH key so you can log into the worker nodes from the manager node without typing a password. The SSH key itself also must not be password-protected.
0.3: Set up manager node environment
On the manager node, enter the following to set up the shell environment:
export MODEL_PATH=<absolute_path_to_model>
export LLMBOOST_IMAGE=<llmboost-docker-image-name>:<tag>
export HUGGING_FACE_HUB_TOKEN=<your_huggingface_token>
0.4 Retrieve /workspace/cluster directory from LLMBoost Docker image
LLMBoost collaterals for a multi-node deployment are packaged in the
LLMBoost Docker image. You need to copy the directory
/workspace/cluster out of the container to use on the manager node.
Enter the following to create a temporary container from the LLMBoost
image and copy out the directory /workspace/cluster. The last
command removes the temporary container.
docker create $LLMBOOST_IMAGE
docker cp <container ID returned by docker create>:/workspace/cluster .
docker rm <container ID returned by docker create>
You will be working on the manager node from the copied
cluster directory for the steps 1~3.
Step 1: Describing the multi-node cluster
Edit the file config.json in the copied cluster directory to
specify the deployment's model settings, node topology, and deployment
roles. The following are the required fields.
| Field | Description |
|---|---|
vars.hf_token | Your HuggingFace token for downloading models |
vars.model_name | The model to load (e.g., "meta-llama/Llama-3.2-1B-Instruct") |
node_config.nodes.<name>.private_ip | The nodes' internal IP addresses for intra-node communication |
node_config.nodes.<name>.public_ip | The nodes' public IP addresses or hostnames for external SSH access |
node_config.common_ssh_option | Global SSH options (e.g., User, IdentityFile) used by all nodes |
manager_node | The hostname of the manager node |
worker_nodes | The hostnames of the worker nodes |
The following example describes a two-node cluster comprising
node-0 and node-1. Both nodes are workers, with node-0 also
designated as the manager node. The file also specifies the language
model to use.
{
    "vars": {
        "hf_token": "<PUT-YOUR-HF-TOKEN-HERE>",
        "model_name": "meta-llama/Llama-3.2-1B-Instruct"
    },
    "node_config":
    {
        "common_ssh_option":
        {
            "User": "<Username on the nodes>",
            "IdentityFile": "~/.ssh/id_rsa"
        },
        "nodes":
        {
            "node-0":
            {
                "private_ip": "<Node 0 private IP>",
                "public_ip": "<Node 0 public IP>"
            },
            "node-1": {
                "private_ip": "<Node 1 private IP>",
                "public_ip": "<Node 1 public IP>"
            }
        },
        "manager_node": "node-0",
        "worker_nodes":
        [
            "node-0",
            "node-1"
        ]
    }
}
Step 2: Prepare and launch inference services
Navigate to the cluster directory on the manager node. Enter the
following to launch the deployment:
./llmboost_cluster
To enable verbose logging, enter the following instead:
ARGS=--verbose ./llmboost_cluster
Please make a note of the login token and the login credential returned by
llmboost_cluster. You will need them to access the management UI in
Step 3 and the monitoring UI in Step 5, respectively
The llmboost_cluster command sets up Kubernetes, installs
dependencies, and initializes the manager and worker nodes.
The inference services on worker nodes will listen for requests on
port 30080. To stop the multi-node inference service, enter the
following from the cluster directory on the manager node:
./llmboost_stop
Step 3a: Accessing the cluster management UI
A management UI is served from port 30081 of the manager node. To
access the management UI, point a browser to the manager node's IP
address followed by the port number 30081. For example, if the manager
node's IP is 10.128.0.1, point the browser to address
10.128.0.1:30081. You can use localhost:30081 if the browser is
running on the manager node.
When accessed for the first time, the management UI will ask for a login token.

After submitting the login token from Step 2, you can access an management UI similar to the screenshot below.

Step 3b: Monitoring the LLMBoost services
Give the inference services a few minutes to get set up after
launching them. Afterward, use curl to check if the
inference services are ready to accept requests. For two
worker nodes with private IP addresses 10.4.16.1 and 10.4.16.2,
check their status from the manager node with the following
commands:
curl 10.4.16.1:30080/status
curl 10.4.16.2:30080/status
The curl command should return output similar to what is shown below, indicating that the endpoints are running.
{"status":"running","server_name":"meta-llama/Llama-3.2-1B-Instruct"}
💡 If your manager node cannot have curl installed, you can launch an LLMBoost container on the manager node and use the curl command from inside the container.
Step 4: Accessing the services as a client
The rest of this tutorial will cover accessing the multi-node inference service from a client's perspective. Follow the instructions from earlier tutorials to start an LLMBoost container on any node that can connect to the manager and worker nodes. You will be entering client commands from inside the container in the rest of the steps.
4.1: Connecting to an endpoint with llmboost client
Inference services on worker nodes will listen for requests on port
30080. Enter the following in an LLMBoost container to start a client
to connect to the inference service on worker node 10.4.16.1:
llmboost client --host 10.4.16.1 --port 30080
💡 If the client node is outside the cluster, you will need to access the worker's public IP address.
4.2: Connecting to multiple endpoints with Python API
A better way to use the multi-node inference service is to spread request traffic across nodes for concurrent processing. You can try this with a simple Python client script provided.
Sample Python Client (client.py)
import argparse
import threading
from queue import Queue
from openai import OpenAI

# Define prompt list
prompts = [
    "how does multithreading work in Python?",
    "Write me a Fibonacci generator in Python",
    "Which pet should I get, dog or cat?",
    "How do I fine-tune an LLM model?"
]

# Thread worker for sending requests
def run_thread(host, queue: Queue):
    client = OpenAI(
        base_url=f"http://{host}/v1",
        api_key="-"
    )
    while not queue.empty():
        prompt = queue.get()
        chat_completion = client.chat.completions.create(
            model="meta-llama/Llama-3.2-1B-Instruct",
            messages=[
                {"role": "system", "content": "You are a helpful assistant."},
                {"role": "user", "content": prompt}
            ],
            stream=False,
            max_tokens=1000
        )
        print(
            f"-------------------------------------------------------------------\n"
            f"Question: {prompt}\nAnswer:{chat_completion.choices[0].message.content}"
        )

# Argument parsing
parser = argparse.ArgumentParser()
parser.add_argument("--hosts", nargs="+", help="list of servers <server_ip>:<port>")
args = parser.parse_args()

threads = []
queue = Queue()

# Populate the request queue
for prompt in prompts:
    queue.put(prompt)

# Launch threads for each host
for host in args.hosts:
    t = threading.Thread(target=run_thread, args=(host, queue))
    threads.append(t)
    t.start()

# Wait for all threads to complete
for thread in threads:
    thread.join()
To run the client:
python client.py --hosts 10.4.16.1:30080 10.4.16.2:30080
4.3: Connecting through the built-in load balancer
llmboost_cluster launches a load balancer that can adaptively
distribute inference requests across the worker nodes, routing new
requests to the node with the least live connections. Simply connect
the client to port 8081 of the manager node to use the built-in load
balancer.
5 Grafana monitoring UI
5.1 Accessing the monitoring UI
The monitoring UI can be accessed at port 30082 of the control node.
For example, if the server is hosted at 10.128.0.1, type in
10.128.1.1:30082 in the browser.
Upon successful login using the login credentials printed out at the
end of deployment, the following screen will show:

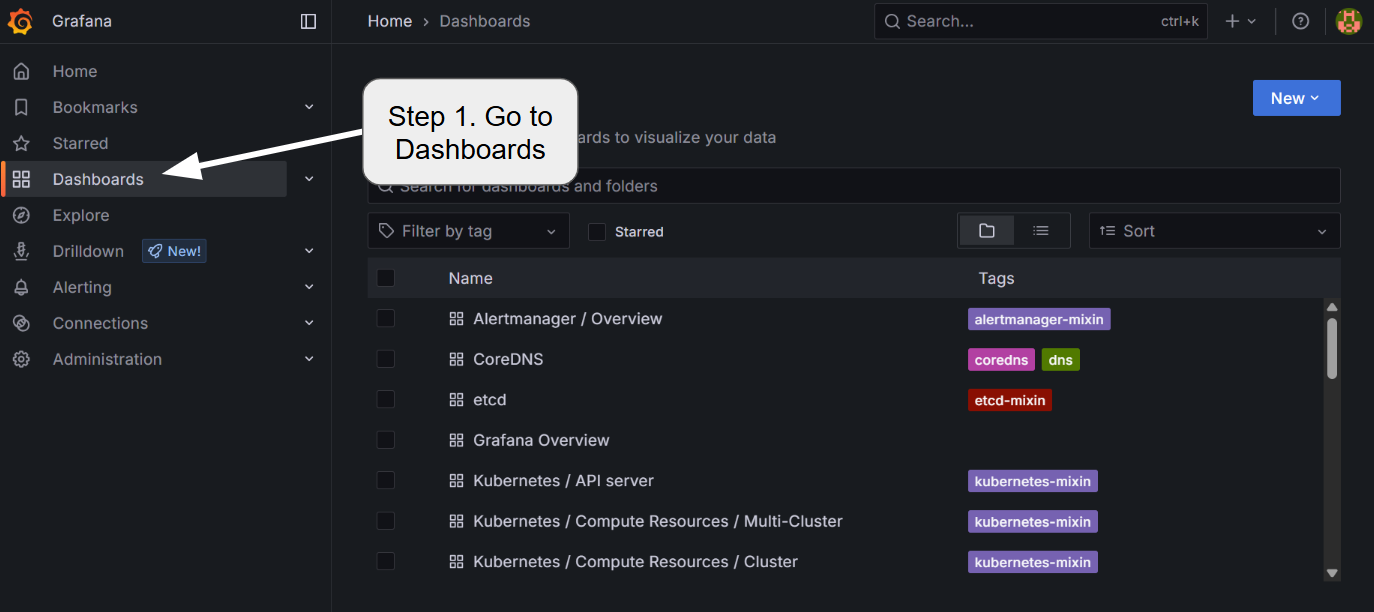
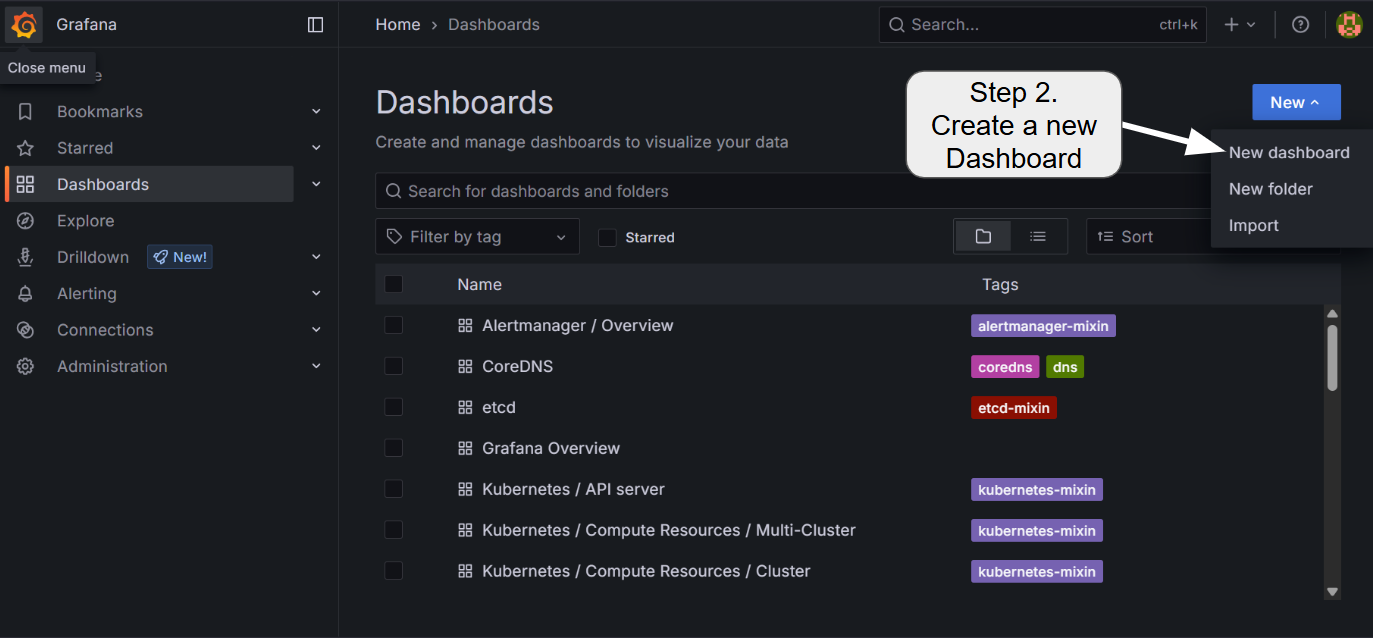
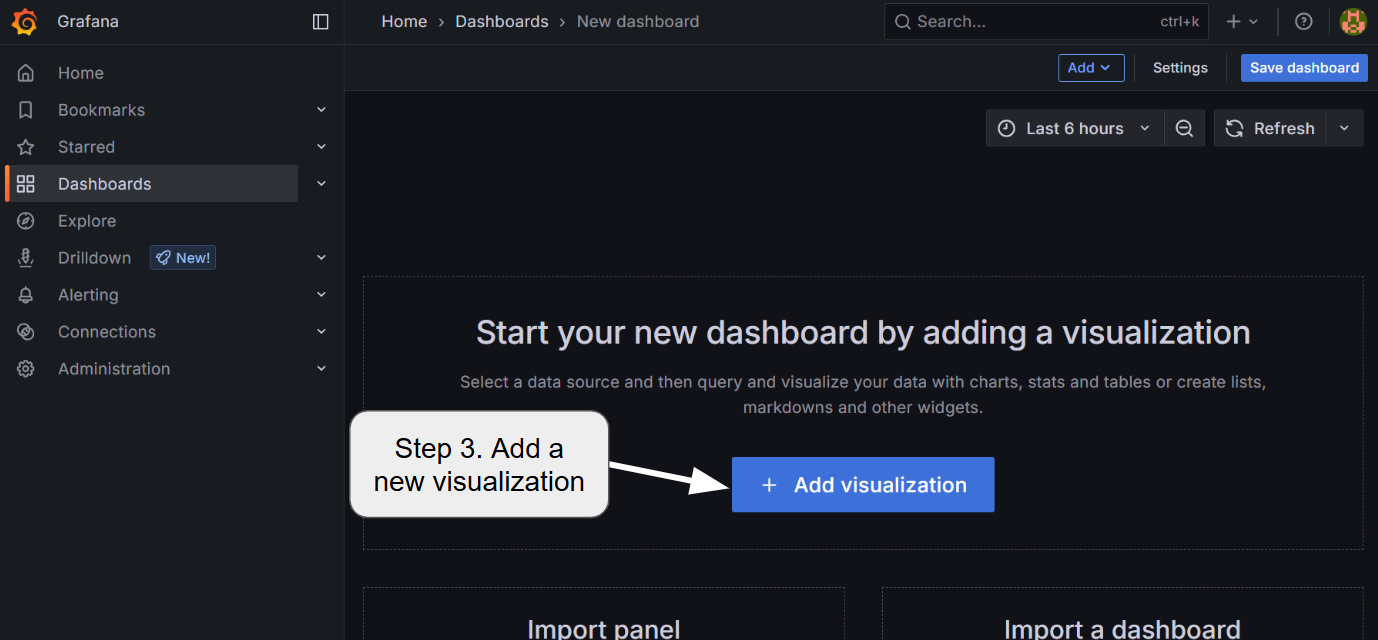
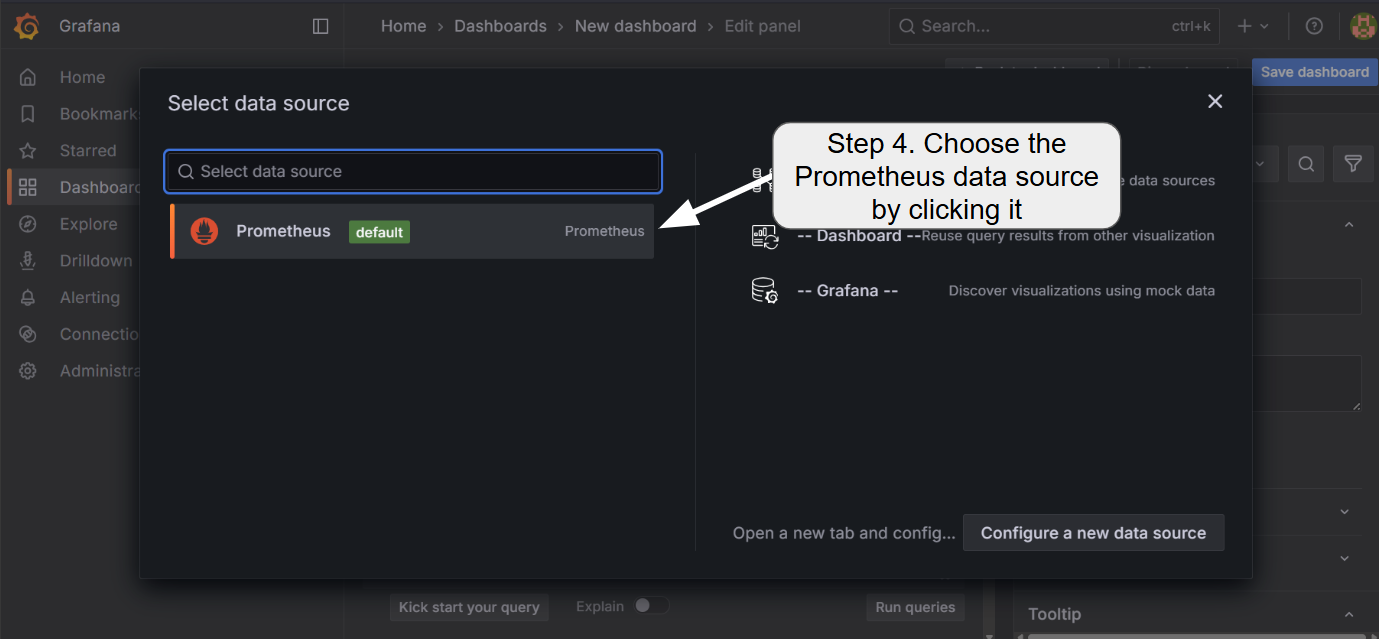
5.2 Adding a new dashboard
To add the visualization dashboard for various metrics including GPU core/memory utilization, temperature, and LLMBoost request statistics, follow the steps:
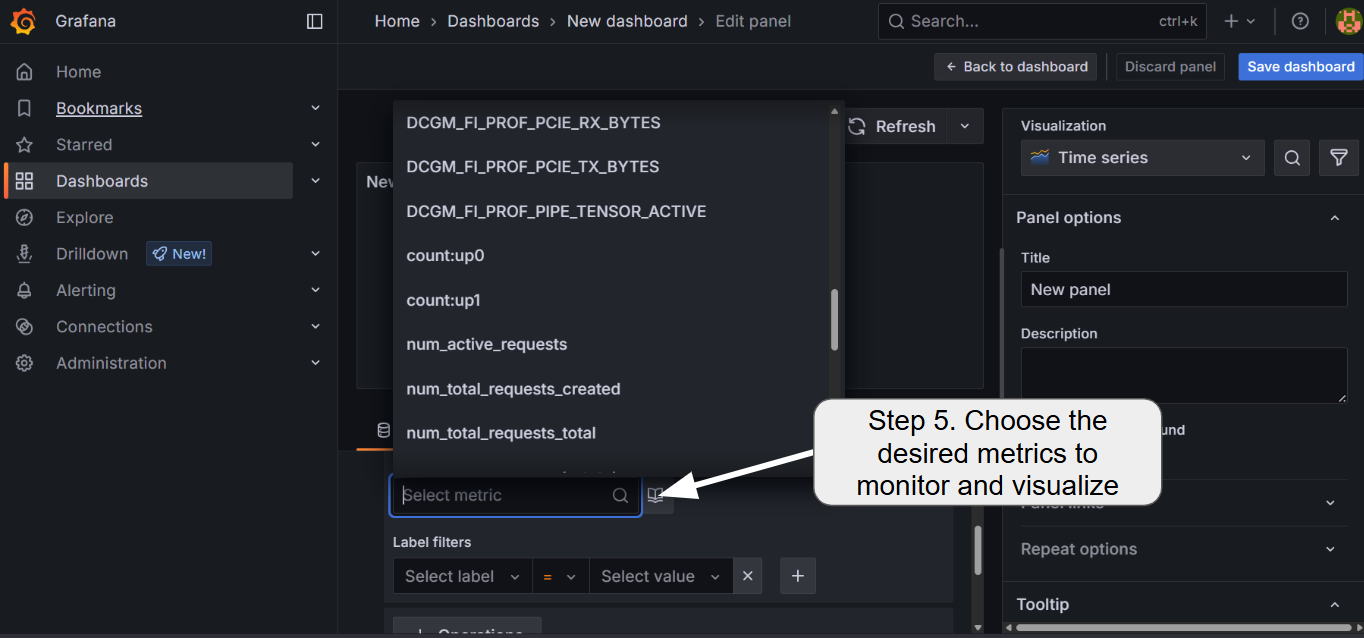
Currently, LLMBoost exposes the following metrics for each of the nodes
num_active_requests: the number of ongoing chat and/or completion requests in the nodenum_total_requests_total: the total number of requests that have been served by the LLMBoost engine in the node so far
Other metrics such as GPU-related metrics are available as well. Because the information is platform-specific, please refer to the following documentations for the GPU-related metrics:
- Nvidia (DCGM)
- AMD (AMD Device Metrics Exporter):